


Product Overview

Recommended excitation wavelengths:
530 nm, 1060 nm (2P)

Absorbance, emission peaks in multilamellar lipid vesicles (MLVs) shown above: 447 nm, 616 nm.
Absorbance, emission peaks in ethanol: 481 nm, 725 nm.
MW: 679.59 g/mol

Recommended excitation wavelengths:
530 nm, 1060 nm (2P)

Absorbance, emission peaks in multilamellar lipid vesicles (MLVs) shown above: 441 nm, 611 nm.
MW: 623.48 g/mol
Alternative names: Di-2-AN(F)EPTEA, PY3243

Recommended single excitation wavelength:
550 nm

Absorbance, emission peaks in multilamellar lipid vesicles (MLVs) shown above: 465 nm, 638 nm
Absorbance, emission peaks in ethanol: 506 nm, 600 nm.
Compatible with ratiometric voltage imaging
MW: 697.58 g/mol

Recommended excitation range:
610 - 650 nm

Absorbance, emission peaks in multilamellar lipid vesicles (MLVs) shown above: 544 nm, 697 nm.
Compatible with ratiometric voltage imaging
MW: 729.65 g/mol

Recommended excitation range:
610 - 650 nm

Absorbance, emission peaks in multilamellar lipid vesicles (MLVs) shown above: 543 nm, 706 nm.
Compatible with ratiometric voltage imaging
MW: 757.70 g/mol
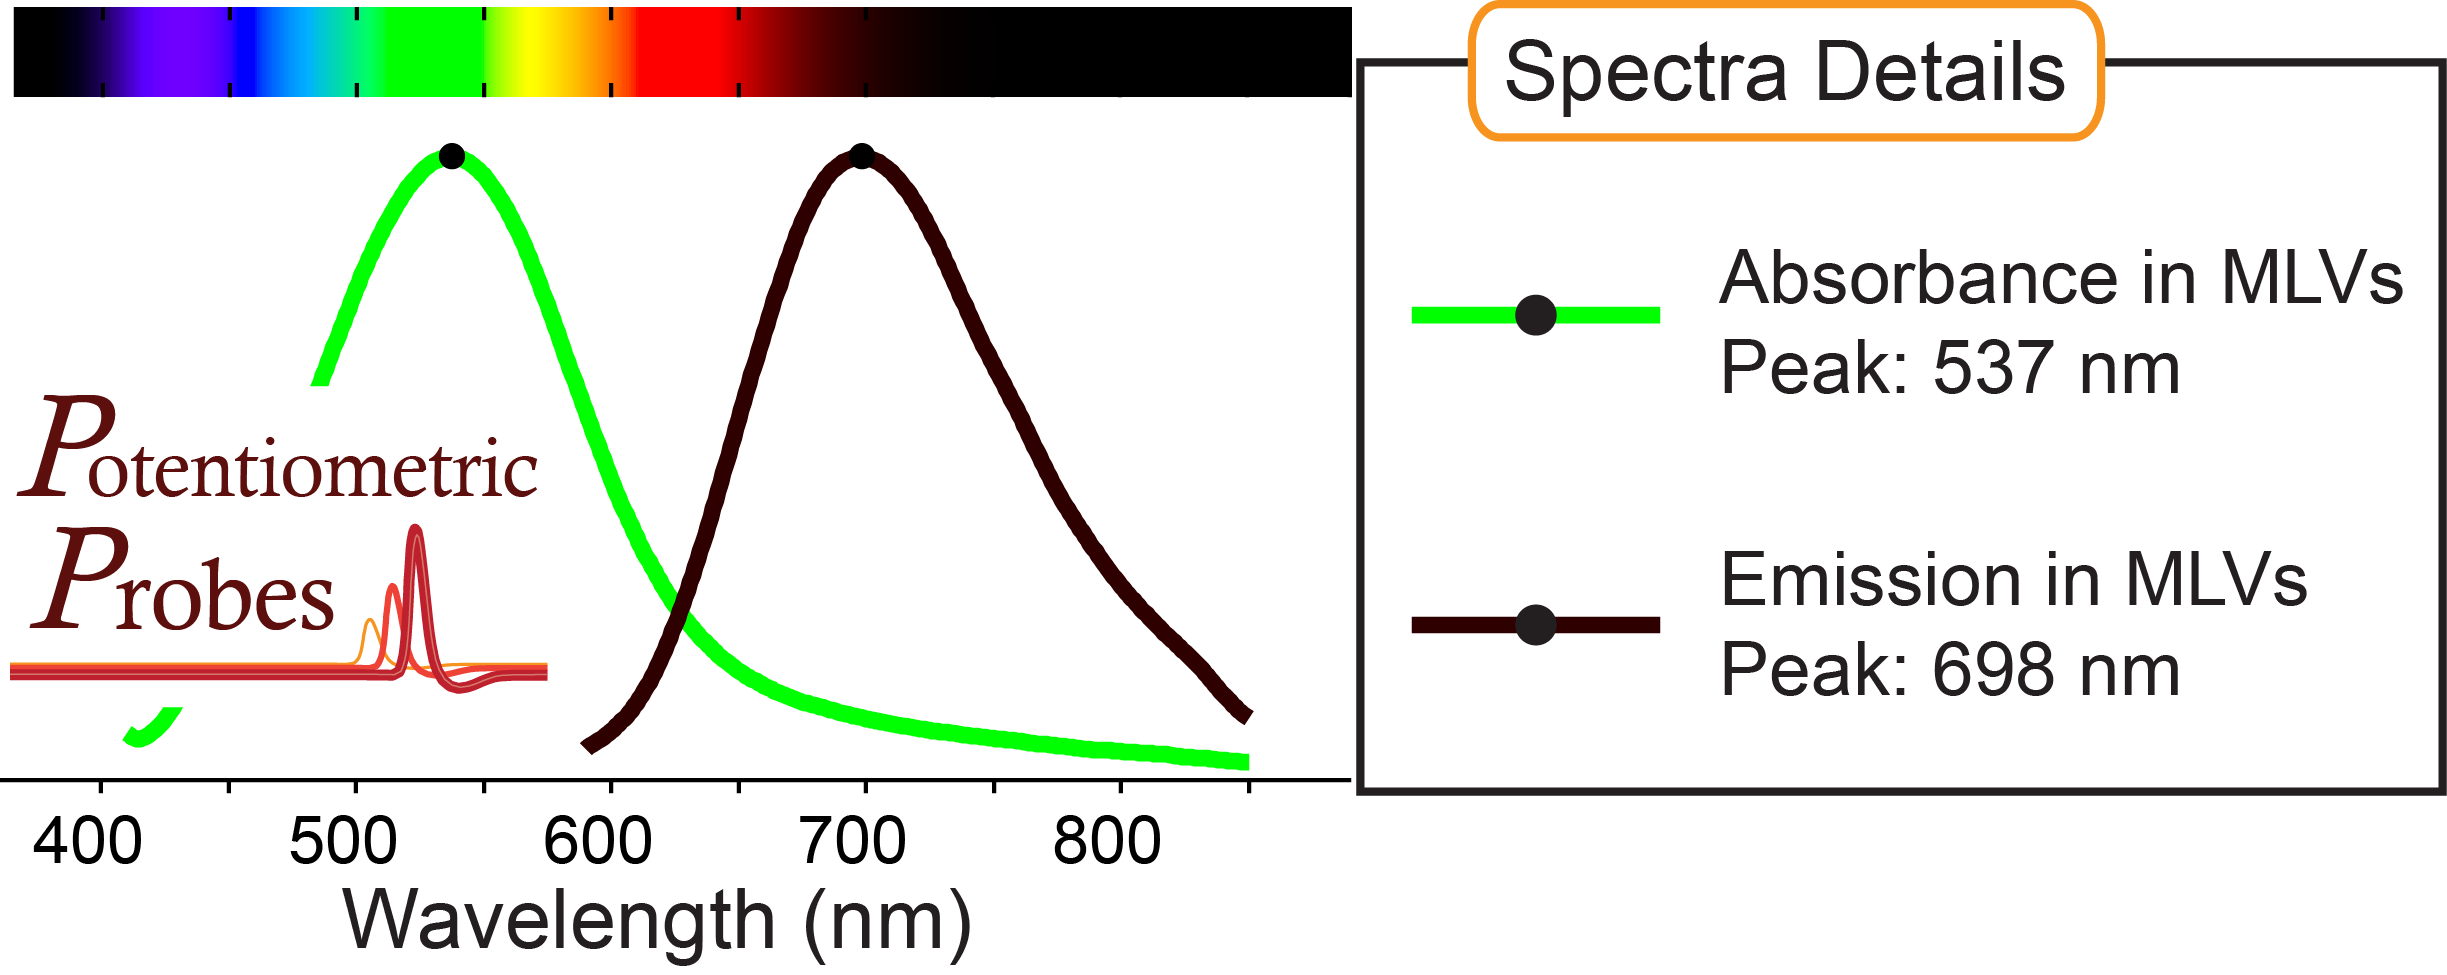
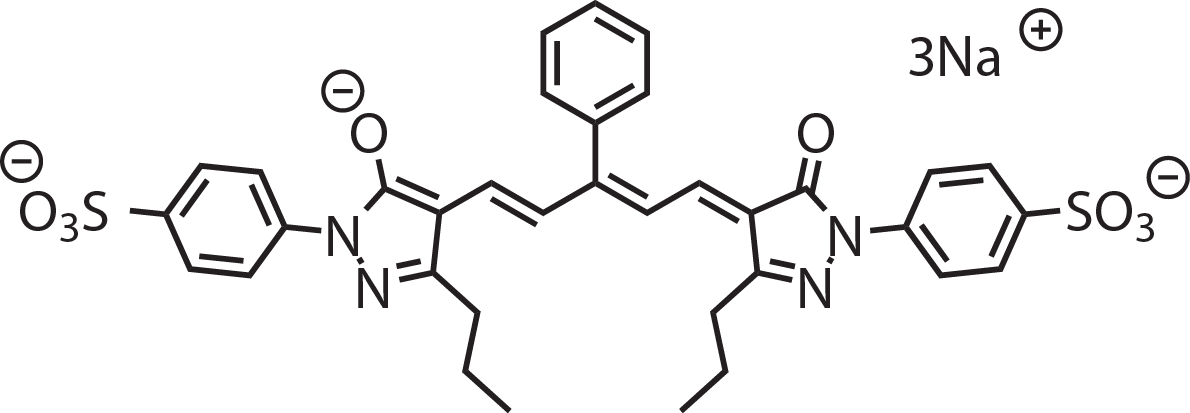
Recommended excitation range:
630 - 650 nm

Absorbance, emission peaks in multilamellar lipid vesicles (MLVs) shown above: 537 nm, 698 nm
Compatible with ratiometric voltage imaging
MW: 562.74 g/mol

Recommended single excitation wavelength:
730 nm

Absorbance, emission peaks in multilamellar lipid vesicles (MLVs) shown above: 609 nm, 731 nm.
MW: 789.76 g/mol

Recommended excitation range:
510-540 nm

Absorbance, emission peaks in multilamellar lipid vesicles (MLVs) shown above: 477.5 nm, 624 nm.
Absorbance, emission peaks in ethanol: 532 nm, 748 nm.
MW: 521.34 g/mol
Recommended excitation range:
510-540 nm

Absorbance, emission peaks in multilamellar lipid vesicles (MLVs) shown above: 477.5 nm, 624 nm.
Absorbance, emission peaks in ethanol: 532 nm, 748 nm.
MW: 549.40 g/mol

Recommended excitation range:
510-530 nm

Absorbance, emission peaks in multilamellar lipid vesicles (MLVs) shown above: 474 nm, 614 nm.
Absorbance, emission peaks in ethanol: 519 nm, 733 nm.
MW: 637.5 g/mol

Recommended excitation range:
510-530 nm

Absorbance, emission peaks in multilamellar lipid vesicles (MLVs) shown above: 472 nm, 615 nm.
Absorbance, emission peaks in ethanol: 519 nm, 733 nm.
MW: 666.55 g/mol

Recommended excitation range:
510-530 nm

Absorbance, emission peaks in multilamellar lipid vesicles (MLVs) shown above: 470 nm, 620 nm.
Absorbance, emission peaks in ethanol: 500 nm, 725 nm.
MW: 480.66 g/mol

Recommended excitation range:
510-530 nm

Absorbance, emission peaks in multilamellar lipid vesicles (MLVs) shown above: 456 nm, 618 nm.
Absorbance, emission peaks in ethanol: 500 nm, 721 nm.
MW: 592.89 g/mol

Recommended excitation range:
620-660 nm

Absorbance, emission peaks in multilamellar lipid vesicles (MLVs) shown above: 531 nm, 722 nm.Absorbance, emission peaks in ethanol: 572 nm, no fluorescence.MW: 570.78 g/mol

Recommended excitation range:
620-660 nm

Absorbance, emission peaks in multilamellar lipid vesicles (MLVs) shown above: 541 nm, 733 nm.
Absorbance, emission peaks in ethanol: 608 nm, 787 nm.
MW: 695.61 g/mol


Absorbance, emission peaks in multilamellar lipid vesicles (MLVs) shown above: 560.5 nm, 588 nm.
Absorbance, emission peaks in ethanol: 551 nm, 578 nm.
MW: 515.0 g/mol


Absorbance, emission peaks in multilamellar lipid vesicles (MLVs) shown above: 559 nm, 589 nm.
Absorbance, emission peaks in ethanol: 551 nm, 579 nm.
MW: 500.9 g/mol


Absorbance, emission peaks in multilamellar lipid vesicles (MLVs) shown above: 598 nm, 693 nm
MW: 612.06 g/mol